Vietnam offers world's most attractive office yields
Latest
| TIN LIÊN QUAN | |
| Vietnam, India eye textile cooperation | |
| A strange business model in Viet Nam | |
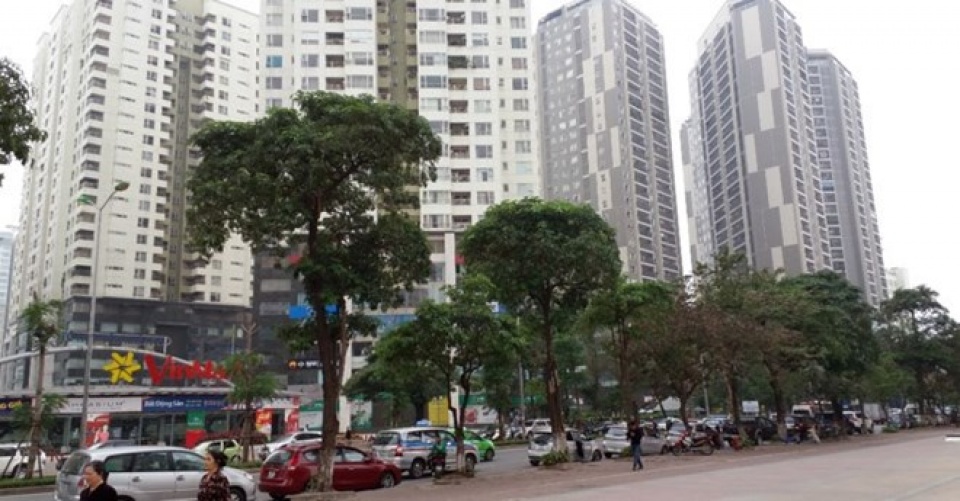
The report, which compared 54 major office markets across, Asia, Europe, the United States and Australia, confirmed that Ha Noi and Ho Chi Minh City posted the highest yields at 8.65 and 7.86 percent.
 |
| Illustrative image. (Photo: VNA) |
Savills Vietnam’s Managing Director Neil MacGregor said that Vietnam’s office market had shown excellent performance, with occupancy rates exceeding 95 percent in central business districts in the two cities.
In contrast, Taipei and Hong Kong were placed at the bottom of the ranking with about 2 and 2.4 percent yields.
According to Savills, for three years running, optimism has dominated the Asian office sector as cheap money has continued to flood local markets and rents and capital values have continued to rise.
The increasing capital inflows have resulted in cap rate compression to decade lows but buoyant demand has led to more new prime office completions and vacancy rates are beginning to creep up.
Investors have generally adopted a positive outlook for local office markets, their confidence bolstered by strong economic growth expectations. The most active markets have been China, followed by Japan and Hong Kong.
However, limited stock for sale in prime areas has meant investors have increasingly turned their attention to development projects in secondary locations.
 | Italy hopes to boost trade with Vietnam Italy wants to boost its investment in Vietnam, focusing on providing more advanced technology equipment at competitive prices, while also supporting the country’s sustainable development ... |
 | Vietnam's economy needs new drivers for growth The Vietnamese economy urgently needs to find new drivers for growth in the period from 2018-20 to achieve rapid but sustainable development, Deputy Prime Minister ... |
 | Quick look at VN economy between 2010-2017 The national economy expanded at around 6% on average and maintained stable increases in foreign investment inflows, foreign arrivals, and export revenues between 2010-2017. |


